Topic 1: Understanding and troubleshooting CrashLoopBackOff errors
A CrashLoopBackOff status in a Kubernetes cluster means that a Container is failing to start, and is therefore being restarted repeatedly. There can be numerous reasons why this might happen. Listed below are some of the most common reasons that may cause this error.
Understanding POD & Container states
It’s helpful to under the POD/Container lifecycle and to see the various states a POD can assume.
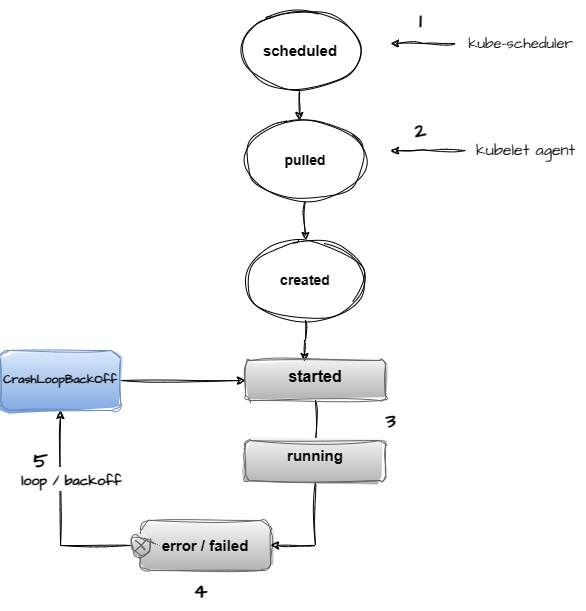
- The Kubernetes scheduler controller schedules the Pod to be run on specific nodes.
- The Kubelet agent on the node is responsible for pulling the image from the container image registry and creating the Pod instance on the respective node.
- The POD container starts based on the specific command provided in the deployment specification. The POD starts running after creation
- After running or during early initialization, an error occurs and the pod goes into an error or failed state.
- The Kubelet agent attempts to restart the container again because the restart policy on a deployment is set to Always, after looping through a few attempts, the POD goes into a CrashLoopBackOff state, with every subsequent run, the backoff time limit increases exponentially up to a maximum of 5 minutes. Note, during this restart loop, a Pod can be in various states, eg. running, error, CrashloopBackOff.
Common troubleshooting steps for CrashLoopBackOff
The following flowchart is a simple guide of how one may start troubleshooting and diagnosing the root cause of a CrashLoopBackOff error.
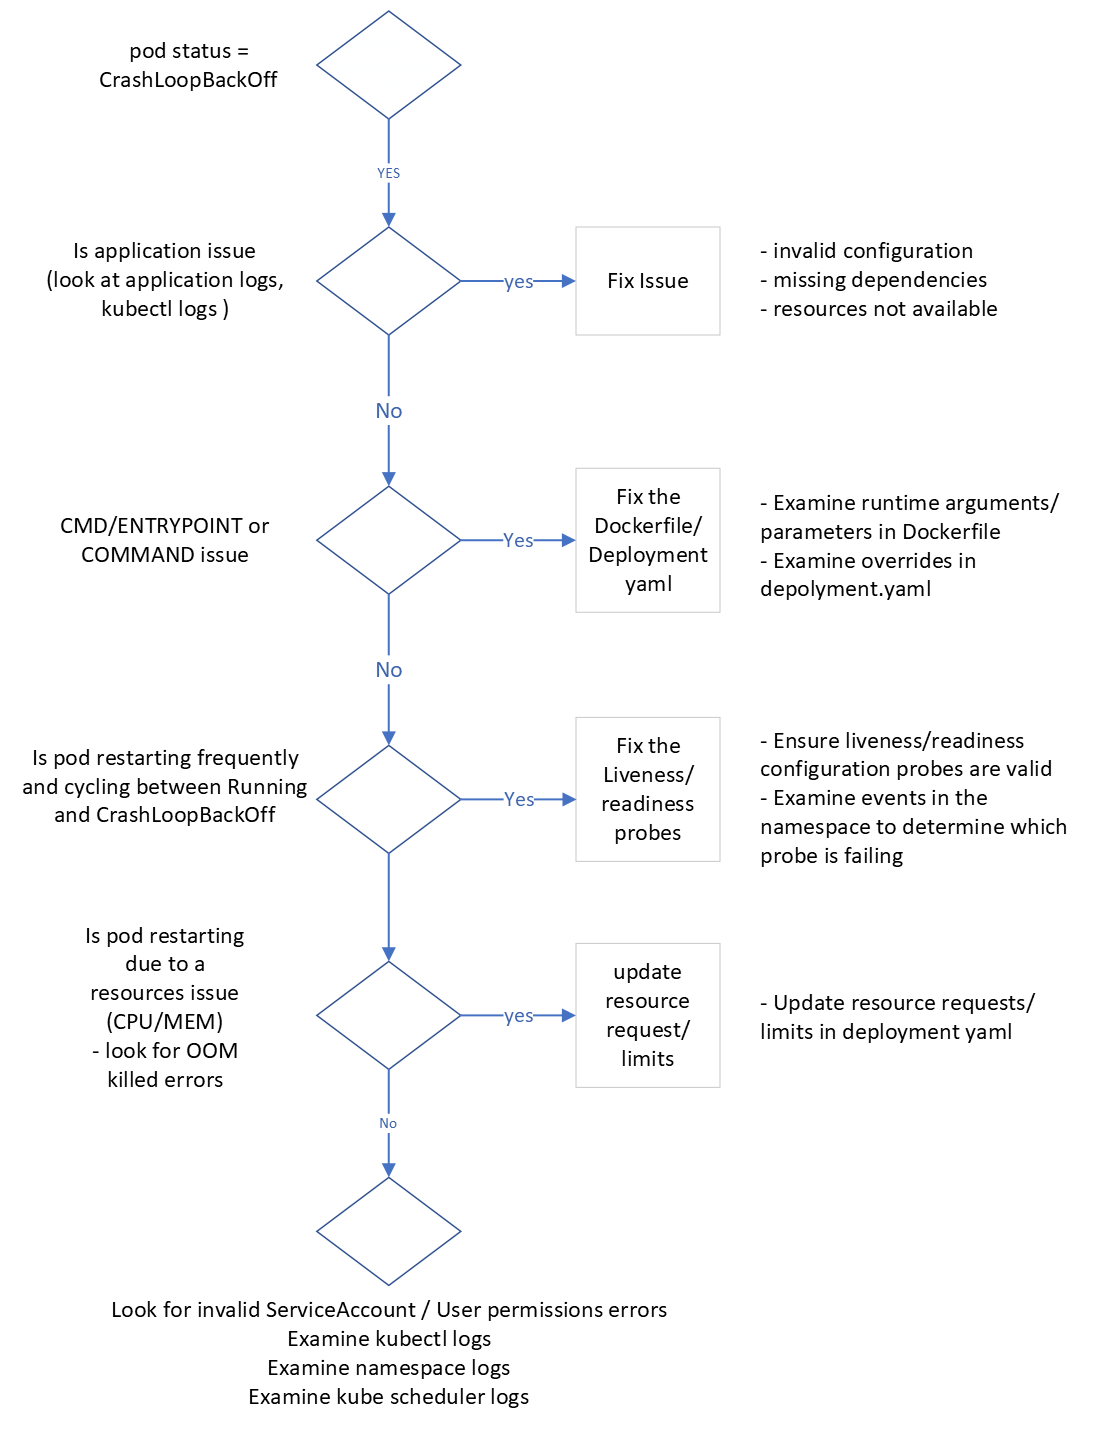
Common causes of CrashLoopBackOff errors
1 Application Configuration Errors:
- Incorrect command or arguments specified in the container spec. (Dockerfile or deployment.yaml)
- Invalid application configuration, for example: missing credentials for a backend database or service.
Sample 1 - Invalid command This first example illustrates a startup command override in the deployment yaml that is incorrect, the command override in the deployment spec is invalid causing the container to go into CrashLoopBackOff
kubectl apply -f .\crashloopbackoff\deployments\deployment-bad-cmd.yaml
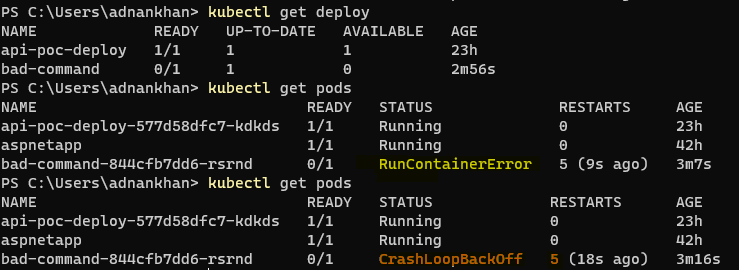
Use kubectl describe pod to get details on failure and state.
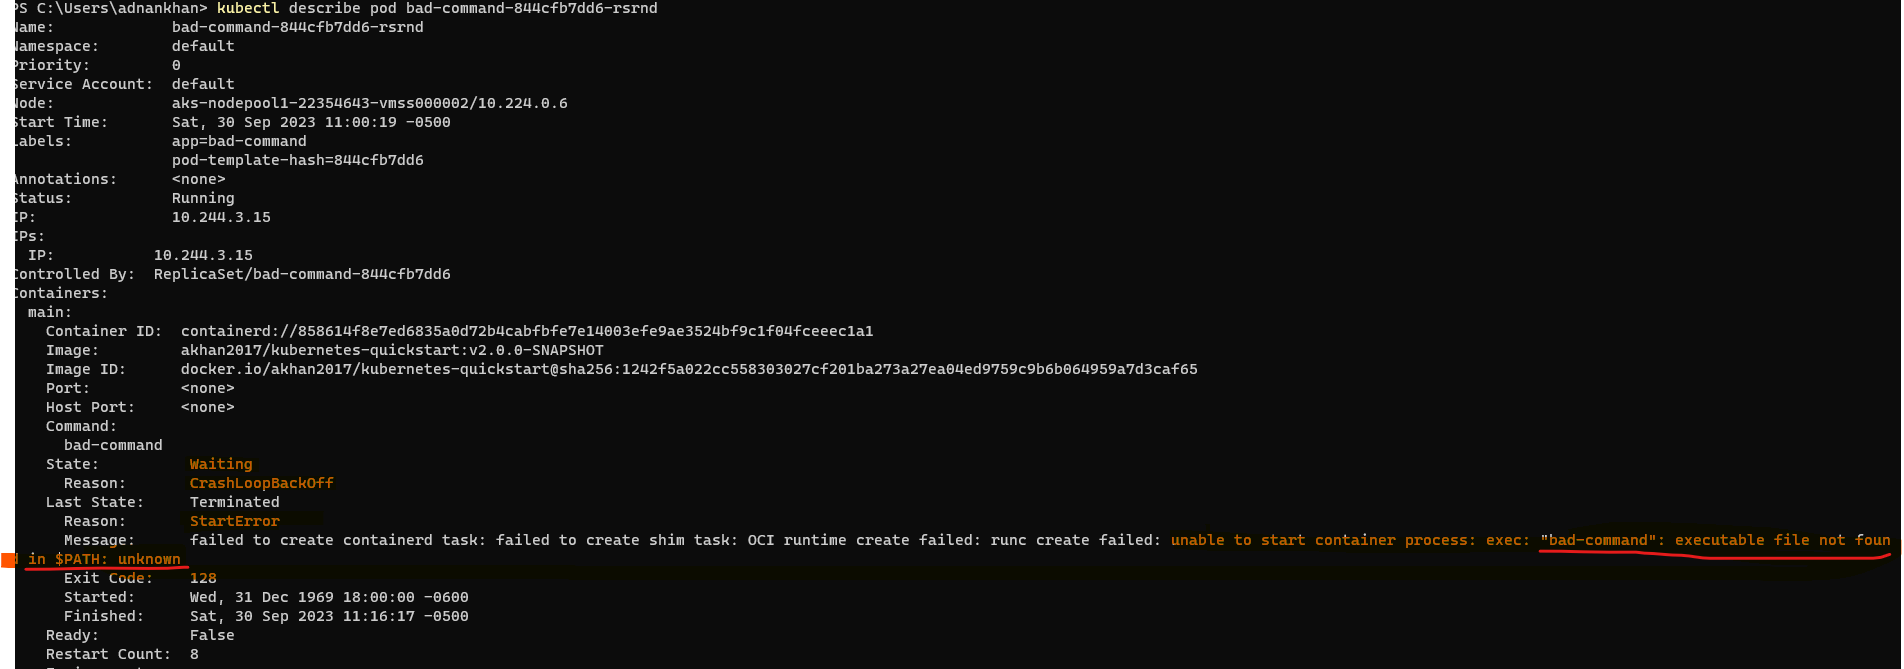
note : Always inspect the Dockerfile CMD/Entrypoint and any overrides in the deployment manifest when “Invalid path” command errors are observed in the pod logs and events.
2 Resource Constraints:
- Insufficient CPU or Memory allocated to the pod.
- Resource Quota Exhaustion: The pod may be attempting to use more resources than allowed or may exceed it’s allocated limited causing an Out Of Memory (OOM) exception.
Sample 2 - OOM Killed This deployment sets an upper memory limit on a pod, the pod runs a number of iterations to consume memory so the limit is exceeded quickly causing the POD to be killed with an OOMKilled error.
kubectl apply -f crashloopbackoff/deployments/deployment-oom-killed.yaml

By doing a Kubectl describe on the POD, we can see the OOMKilled error reason.
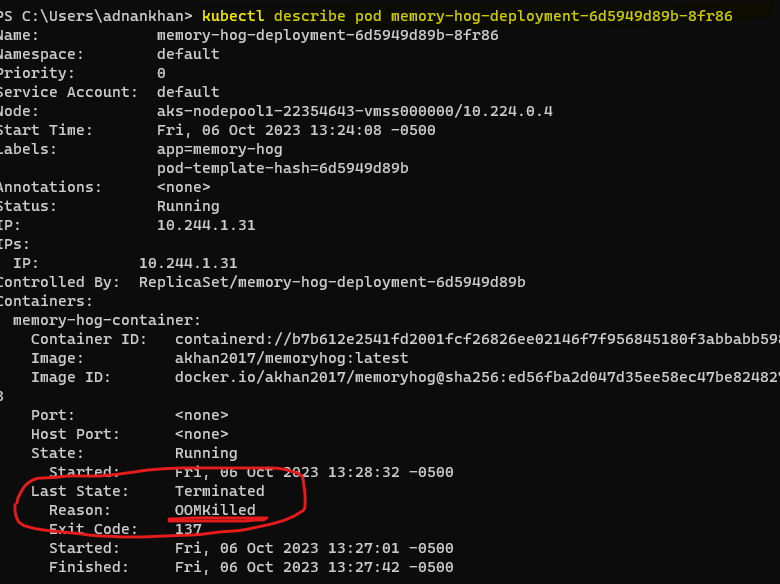
note to fix the OOMKilled error, increase the memory limit for the pod in the deployment manifest file.
3 Application Errors:
-
Application inside the container is crashing due to errors at startup, this may be due to initializing or dependency injection errors.
-
Application Dependency Issues:
- Required downstream services or endpoints are not accessible or are timing out causing the container’s process to fail.
Sample 3 - Application startup failure This example is an application config issue, the application starts and then fails because a required dependency injection fails because of an invalid backend resource configuration.
kubectl apply -f .\crashloopbackoff\deployments\deployment-invalid-app-config.yamlNotice how the POD state moves from Error to CrashLoopBackOff

Notice the application exit code of 1 denoting the application error

kubectl logs shows the Java application exception stacktrace shortly after startup
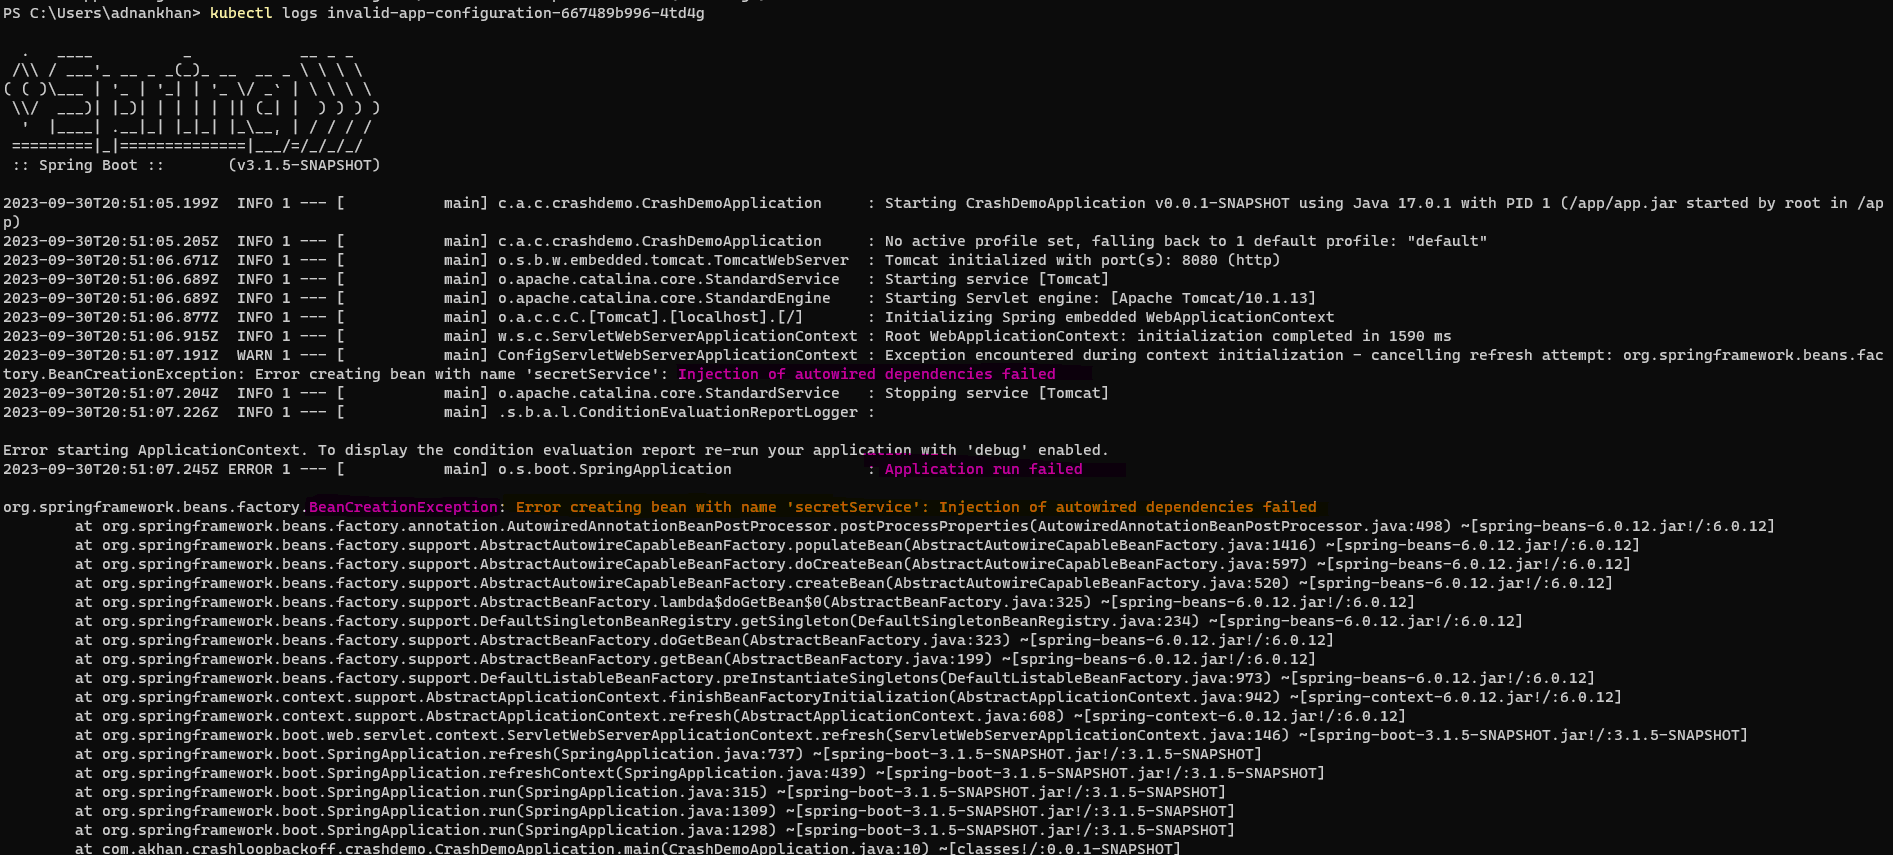
note Most dependency injection frameworks like SpringBoot and .NET will often fail at startup due to object initialization failure and cause CrashLoopBackOff errors.
4 Permission Issues:
- The container is trying to perform actions it does not have permissions for, leading to a failure.
- An Incorrect Security Context or Service Account is associated with the pod.
Sample 4 - Application startup failure The following sample POD is trying to run the container as a user that does not exist. runAsUser: 1234
kubectl apply -f .\crashloopbackoff\deployments\deployment-invalid-user.yaml
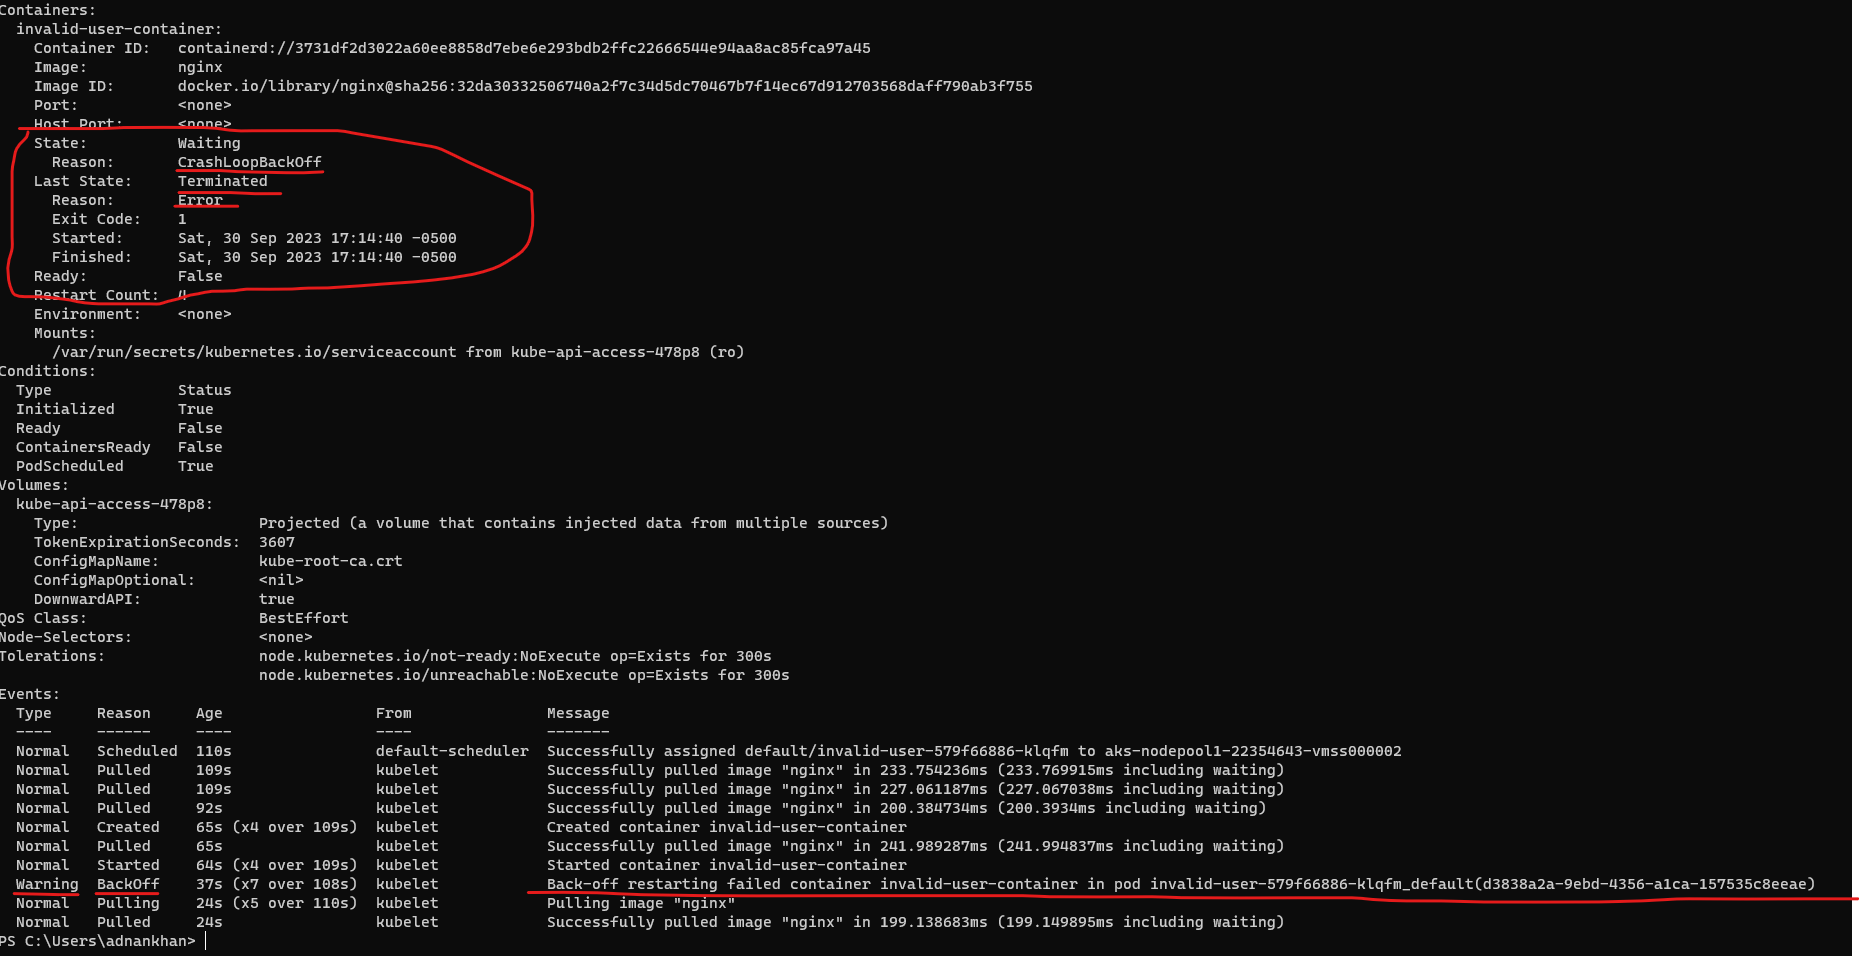
kubectl logs show a user error and Permission denied error 
5 Liveness/Readiness Probes Failure:
- Misconfigured or overly aggressive liveness/readiness probes causing the container to be terminated and restarted.
Sample 5 - Liveness Probe errors The following sample POD is configured with a liveness probe but the probe URI is invalid and results in an 404 not 200 response and thus causes the pod to get restarted.
kubectl apply -f .\crashloopbackoff\deployments\deployment-failure-probe.yaml
 kubectl describe pod clearly shows the Liveness probe failure in the event logs.
  Note The status moves continuously from Running to CrashLoopBackOff
Note Pay special attention to certain liveness/readiness probes parameters, these include
- TimeoutSeconds - The default is 1 second which may cause certain probes to timeout
- InitialDelaySeconds - Sometimes a container may need additional time to ramp up and the default may not be applicable, this is especially true for workloads consuming a lot of downstream services line Databases, Message Brokers, etc.
These are other reasons a Pod may enter this state, the following can also cause this but unlikely. Examine Kubelet, cluster logs for detailed information
- Node Issues:
- Issues with the Node itself, such as disk pressure, could indirectly cause containers to enter
CrashLoopBackOffstatus.
- Issues with the Node itself, such as disk pressure, could indirectly cause containers to enter
- Quota and Limit Issues:
- Exceeding CPU/Memory limits, leading to the termination of containers.
- Hitting File descriptor limits.
Useful Log Analytics (KQL) queries
If you have enabled Azure Container insights and Log Analytics for your AKS cluster, you can run queries to get detailed information on the frequency and timing of CrashLoopBackOff errors
The following sample query will return container details by namespace for the last hour for any containers that had a restart count of greater than 5 within the last hour.
KubePodInventory
| where ClusterName == "ktb-aks"
| where TimeGenerated > ago(1h)
| where ContainerRestartCount > 5
| project Name, Namespace, ContainerID, ContainerRestartCount
The following sample query will return container details for any pods in the CrashLoopBackOff status since the last 24hrs.
KubePodInventory
| where ClusterName == "ktb-aks"
| where TimeGenerated > ago(1d)
| where ContainerStatusReason == "CrashLoopBackOff"
| project Name, Namespace, ContainerStatusReason
The following query summarizes all the warnings by type and namespace for the last 24 hrs.
KubeEvents
| where ClusterName == "ktb-aks"
| where KubeEventType == "Warning"
| where TimeGenerated > ago(1d)
| summarize Count=count() by Namespace, Reason
| order by Count desc